Curb Your Enthusiasm
By Dimitri Triantafyllides, CFA
Decades from now, a new generation of investors may have a hard time pinpointing the COVID-19 pandemic and lockdown era on a historic stock performance chart. The S&P was up more than 17% in 2020 and another 13% or more year to date even though the US economy shrank as much as 30% annualized in a single quarter. The second most material event of the century so far (second to the 2008 credit crisis) really played out to have been a “massive buying opportunity.” With the Federal Reserve flooding the markets with liquidity, and the rapid response of fiscal stimulus through the passage of the CARES Act, any immediate market pessimism was, within a couple of months, replaced by risk taking ad nauseum. Even as 2021 has progressed, renewed fiscal stimulus, Federal Reserve monetary accommodation and expectations of a massive infrastructure spending bill have all helped keep the stock market on the front foot. With this backdrop, we are not surprised that most investors seem to be asking for more equity exposure, particularly in a world of few income generating alternatives. But, is this a wise investment strategy?
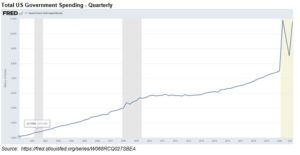
The amount of government spending through all the stimulus programs can be seen from the following chart, which shows total quarterly US government expenditures. What had been a roughly $7.5 trillion quarterly spending pace growing on average by $50 billion per quarter pre-pandemic, is now a near $11 trillion quarterly pace.
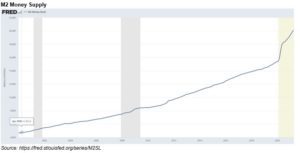
Not to be outdone by Congress, the Federal Reserve has done its share of heavy lifting through its continued asset purchase program. As can be seen by the accompanying chart, the money supply (as measured by M2), has increased by about $4 trillion since last March. By comparison, we note that even following the 2008 financial crisis, M2 increased only about $1 trillion.
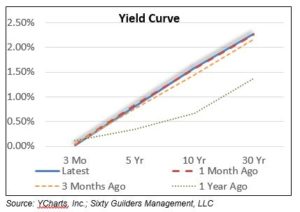
This print and spend strategy duo has begun to have some impact in the money markets and interest rates even though the Federal Reserve keeps insisting that it intends to keep interest rates low for the foreseeable future. Nonetheless, while short term rates have remained low, as can be seen in the attached chart, the US government bond yield curve has begun to steepen, with the 10-year Treasury note now touching 1.60%, up around 1% from a year ago. While a steepening yield curve can be a sign of a healthy economic outlook, the rapid pace of the repricing of time value of money implies more than just a healthy outlook. It potentially implies that the “bond vigilantes” (to use an almost forgotten term to describe the wisdom of the market to keep fiscal and monetary policy honest) are raising a caution flag to all the money sloshing around since last spring, with no end appearing in sight.
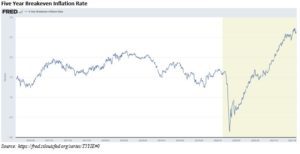
As rates have increased it’s important to note that inflation expectations have also increased. While the Federal Reserve appears willing to do anything to help inflation expand to 2%, the markets are now betting that on a forward 5-year look, inflation will exceed 2.5%. While this is not materially different to the Fed objective, it may serve as a canary in the coal mine, were this important metric to continue increasing.
For those investors looking to put capital to work, the alternatives seem slim: money market rates effectively zero, 10-year US Treasury offering less than 1.6%, investment grade bonds at less than 2%, high yield (junk) bonds less than 5%, and the earnings yield (the inverse of the P/E ratio) on the S&P 500 at around 4.6% (with a dividend yield of around 1.4%) (source: YCharts, Inc.; Sixty Guilders Management, LLC). Under such an environment we continue to encourage prudence, patience, and long-term thinking. We would rather own fewer equities and less risky equities in such a market, willing to forego upside performance for better downside protection.
BRC Wealth Management (brcwm.com)